App Overview
How to get started.
01. Define your project
Complete this form to configure your project in eOceans.
This tells eOceans your:
study area — the project’s boundaries
sampling methods — what types of data the project will accept
variables — what you are interested in, such as species, social values, threats, environment
🌀 This customizes your project to your needs, and gets you ready in minutes.
🌀 The system then sets up your data schema, databases, analysis, reports, and user interfaces in the eOceans mobile app and dashboard.
▶️ Watch this video for a walkthrough.

02. Add your trusted data
Upload your existing datasets with Magic Uploads™, stream field data from your team using the eOceans mobile app, and connect sensors through a custom API.
🌀 As data streams into your project, eOceans goes through many invisible checks and validations based on the project configurations in Step 1.
🌀 As the data are added to your project, they are available for human-in-the-loop validations and automated validations by the project admin or team.
🌀 The more validations the data go through, the stronger the results.
🌀 The data are then fed through your analyses, and the results and visualizations regenerate — always staying up to date with the most recent data.

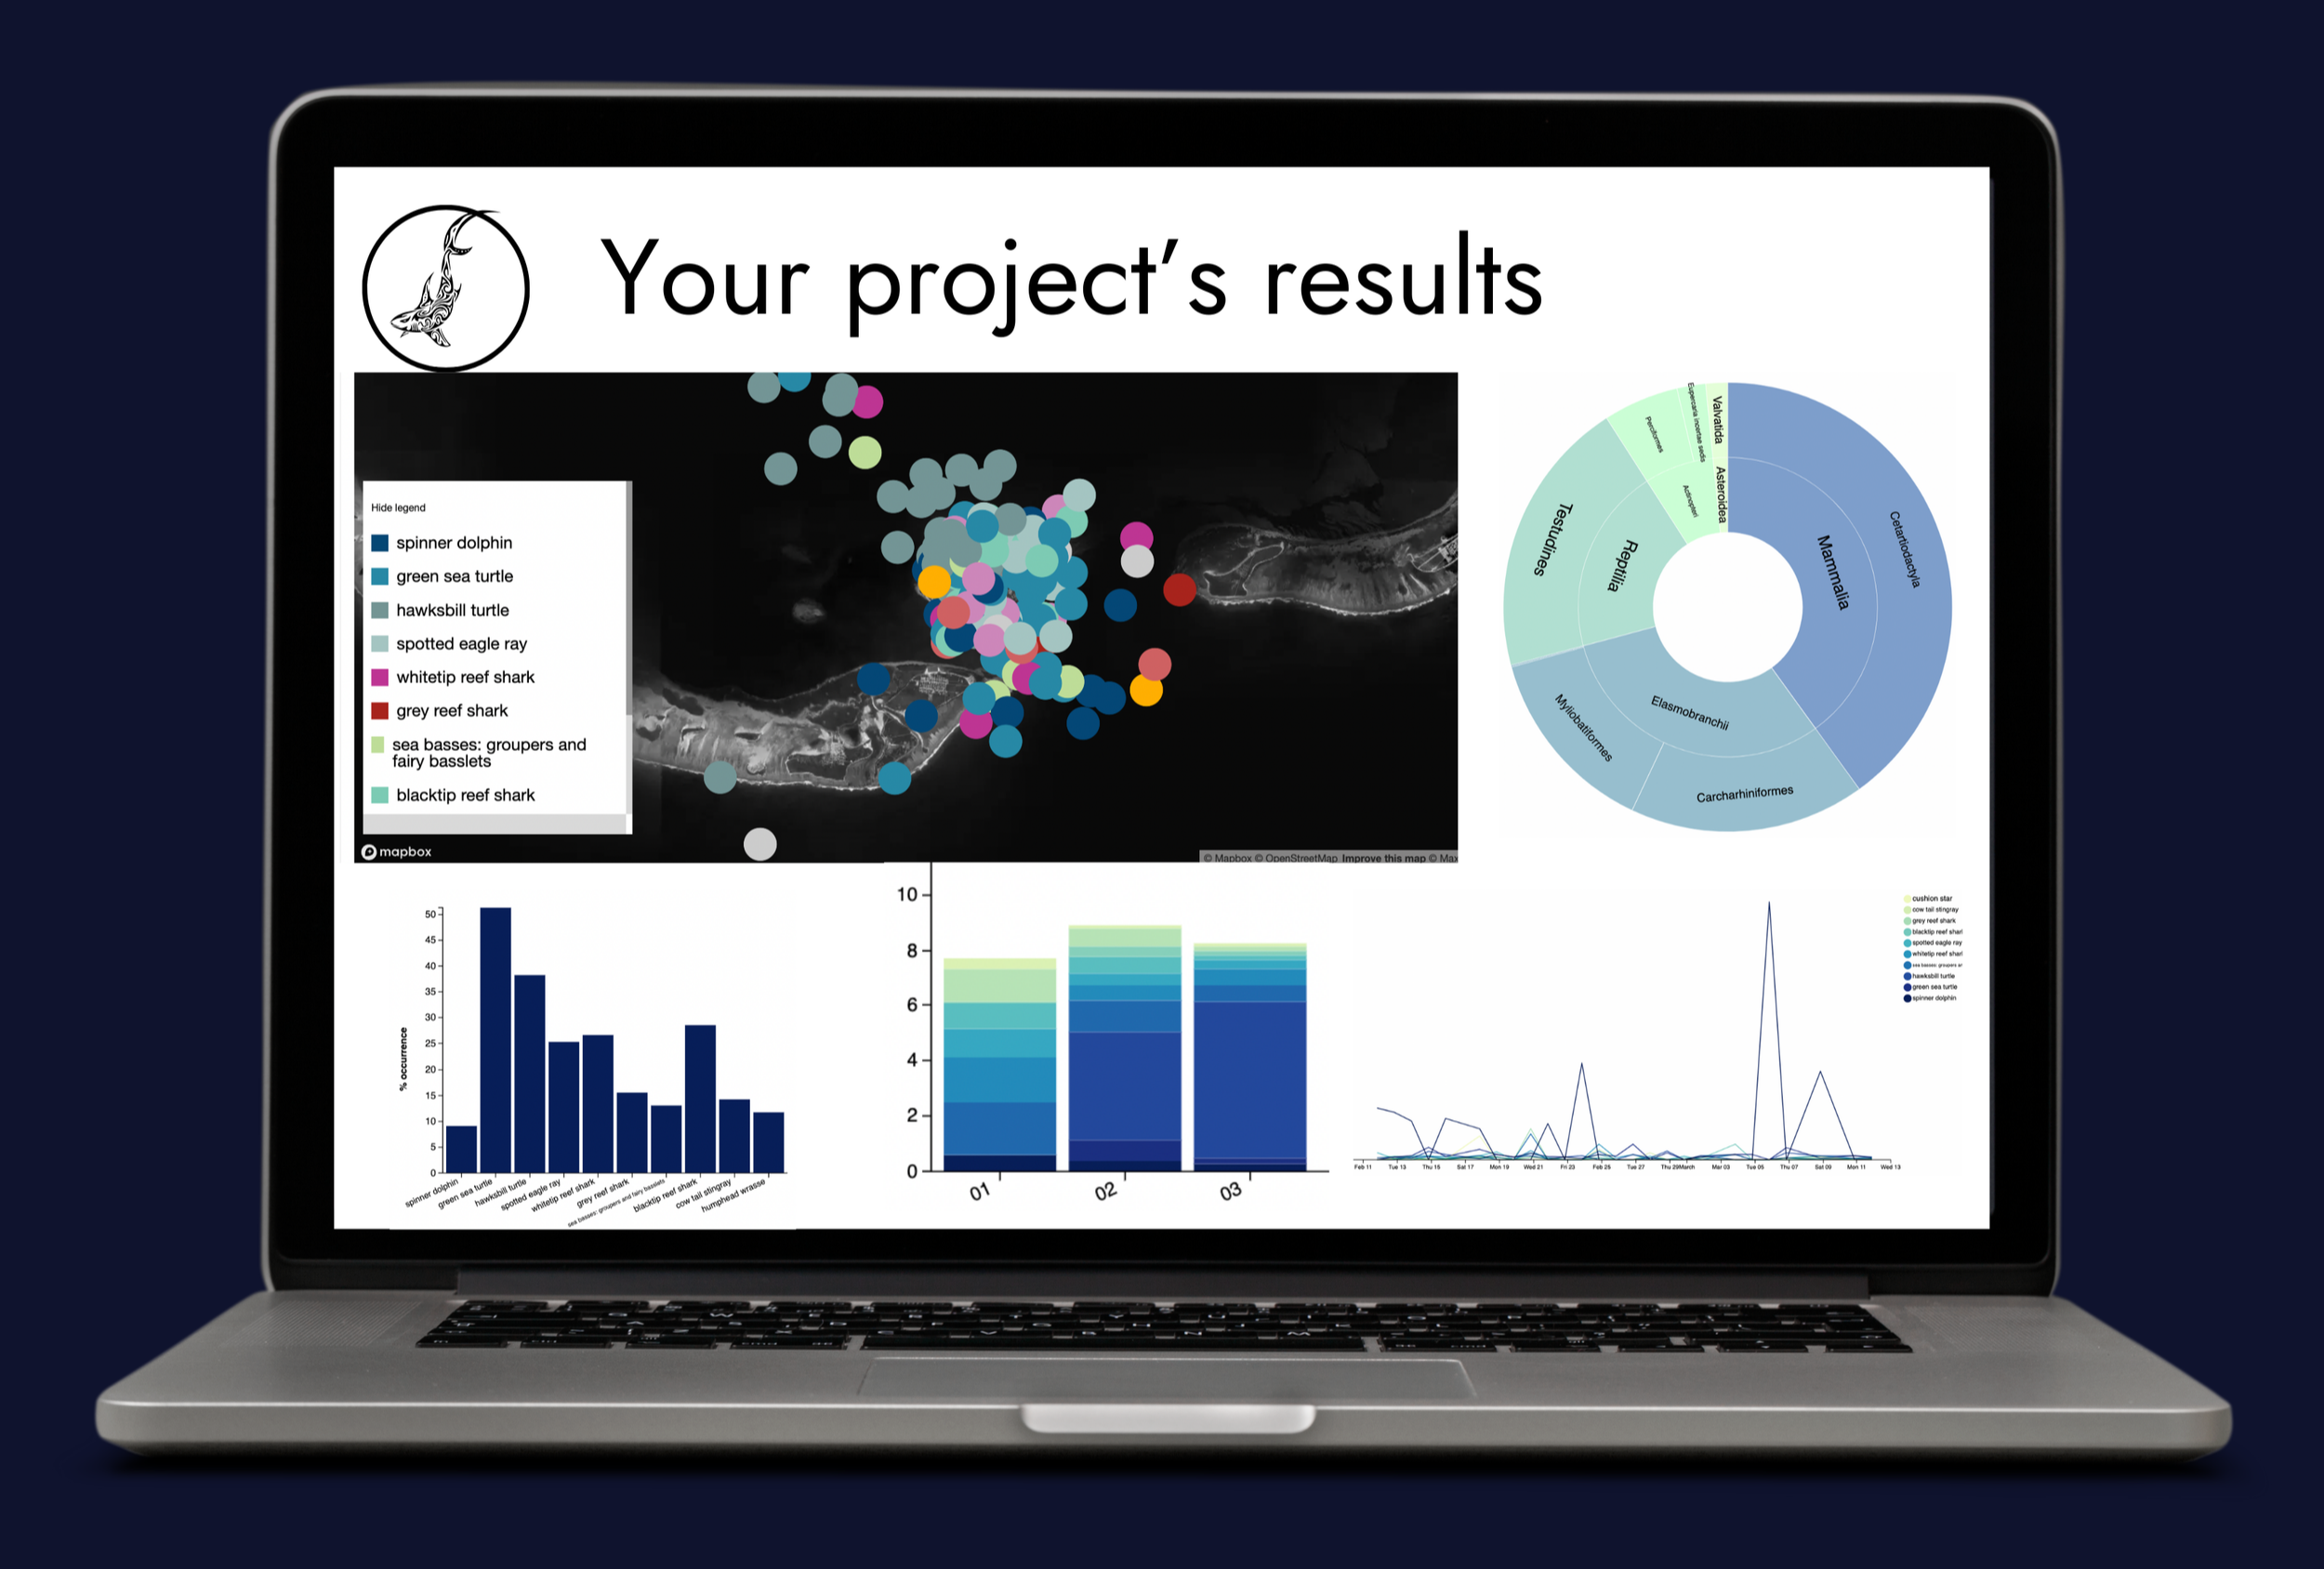
03. Review results, share reports and publications
As data flows into your project, you can interpret the results, add discussions, and share links to your live, interactive dashboard, updated static reports, or publications.
🌀 This means you have the insights needed to inform decisions, investments, opportunities, and more.
🌀 When you share, your clients, stakeholders, rights holders, funders, or the public can review the results and stay up to date.
🌀 Share reports as HTML or PDF for maximum impact.